PagerDuty Guide
Context
PagerDuty is an incident alerting tool. It does not identify incidents itself, but manages on-call schedules and the distribution of notifications.
The incidents themselves come from AWS CloudWatch Alarms which we have configured (in Terraform) to alert us when exceptional circumstances occur: an increase in error messages, failing healthchecks, high CPU load etc. When the CloudWatch Alarm status returns to “OK”, the PagerDuty incident will immediately be resolved.
Configuring your notification settings
In your PagerDuty user settings you can configure when and how you should be notified about PagerDuty incidents. You are free to set these up however suits you, but you should certainly receive immediate notifications for high-urgency incidents.
High-urgency incidents are those which happen in production services and therefore are essential to resolve to continue production operations. Low-urgency incidents are from non-production environments and may not need immediate action: they are often resolved elsewhere, such as through a subsequent deployment.
Understanding an incident
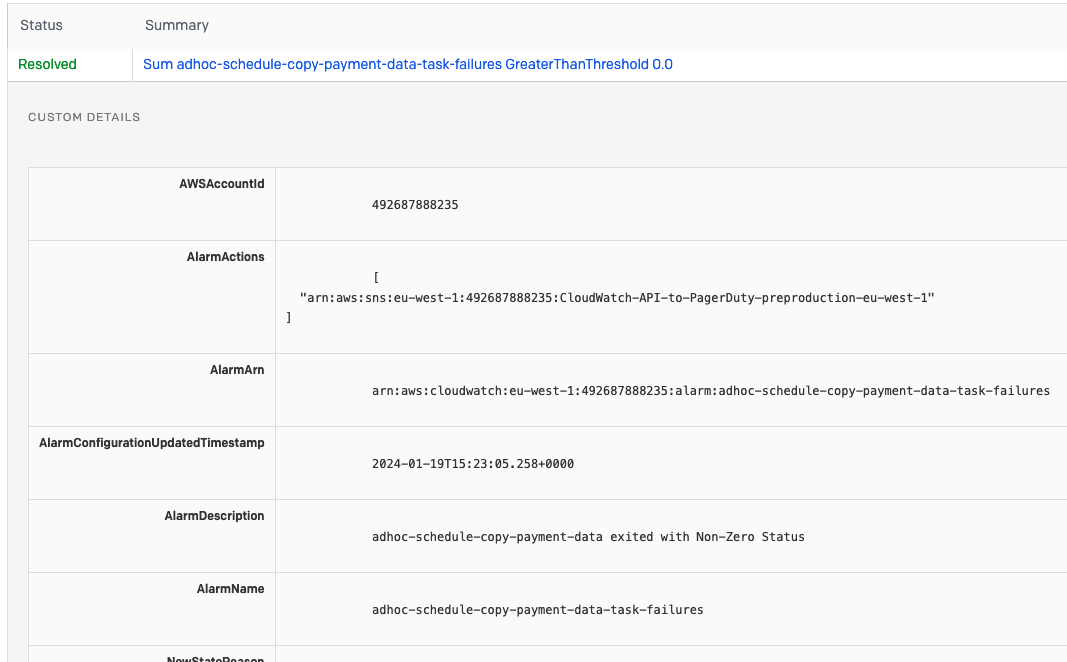
The integration between PagerDuty and AWS has some limitations, meaning the incident title may not make the cause of the incident immediately obvious. It’s therefore suggested that you look at the “custom details” of the incident, which includes all the data sent from AWS CloudWatch. This is visible in the PagerDuty UI, and partially shown in email notifications.
The custom details include the “AlarmName”, which is the canonical name of the CloudWatch Alarm which triggered, and the “AlarmDescription” which provides a human-readable description of what went wrong. They also include the “AWSAccountId” which will confirm the AWS account if this is not clear from the AlarmName.
If you find that the AlarmDescription isn’t a helpful explanation, please update it in the opg-sirius-infrastructure repository.
Taking action
When dealing with an unfamiliar alarm, you should first find it in the AWS CloudWatch Dashboard where you can see how it is defined and how the underlying metric has historically performed (to spot if this is a sudden or common event, for example).
If this event is causing a user facing outage, follow the Incident response process to raise an incident.
If you are unsure how to proceed, talk to the other developer/WebOps engineer on-call this week. You can also ask for help in shared channels (e.g. #opg-starfox or #opg-sirius-develop).
Common alarm reference
Here are some common alarms and some tips on how you might want to investigate them further if they occur when you are on-call.
CIS-3.1-UnauthorizedAPICalls
This alarm is from Center for Internet Security (CIS) best practices, and is triggered whenever an unauthorised request is made to the production account. Whilst this could indicate a malicious attempt to improperly access AWS resources, it might equally be another OPG service failing to authenticate properly or an unintentional mistake whilst swapping between profiles in the AWS console.
{env}-generic-go-runtime-panic-errors
These alarms are triggered when a Go ECS service fails abruptly. You should use the Sirius/Errors-{env} saved query in Logs Insights to identify which service failed and what the error was.
The service should have automatically restarted after the failure, you can check this in AWS ECS.
Depending on the error, you’ll probably need to create a ticket to fix the underlying cause in the code to ensure it doesn’t recur.
{env}-{service}-5xx-errors
These alarms are triggered when the number of HTTP responses with a status code between 500 and 599 (indicating a server, rather than client, error) is abnormally high. You again should be able to detect this using the Sirius/Errors-{env} saved query in Logs Insights.
These error may have crashed the service, so it’s worth checking AWS ECS. Like the runtime errors above, you will likely need to create a ticket to ensure the underlying error doesn’t recur.
{env}-sirius-synthetics-{test}-success-percent
These alarms are triggered when an AWS CloudWatch Synthetic smoke test is repeatedly failing. You should check the Synthentics dashboard to see which Synthetic is failing and why. The dashboard takes screenshots to
This is typically caused by code changes or slow page load time. Depending on the failure you may need (with the support of relevant teams) to revert or fix the code, or the Synthetic may need to be updated if the code change was valid and the Synthetic is now out-of-date.
Due to the likelihood of being triggered by a code regression, Synthetics failures are also posted to the #opg-sirius-supervision-devs channel in Slack, tagging both Supervision and POAS developer teams.
